Published August 23, 2022 12:17PM
Four Major UTMB Takeaways For Pacing and Predictions, Based on Historical Data
The historical data at UTMB paints a fascinating picture of one of the hardest and most competitive races in the world. Using data on past race-day results and splits, Dr. Marshall Burke completed regression analyses that provide 4 insights and predictions about what we might see in the 2022 race.
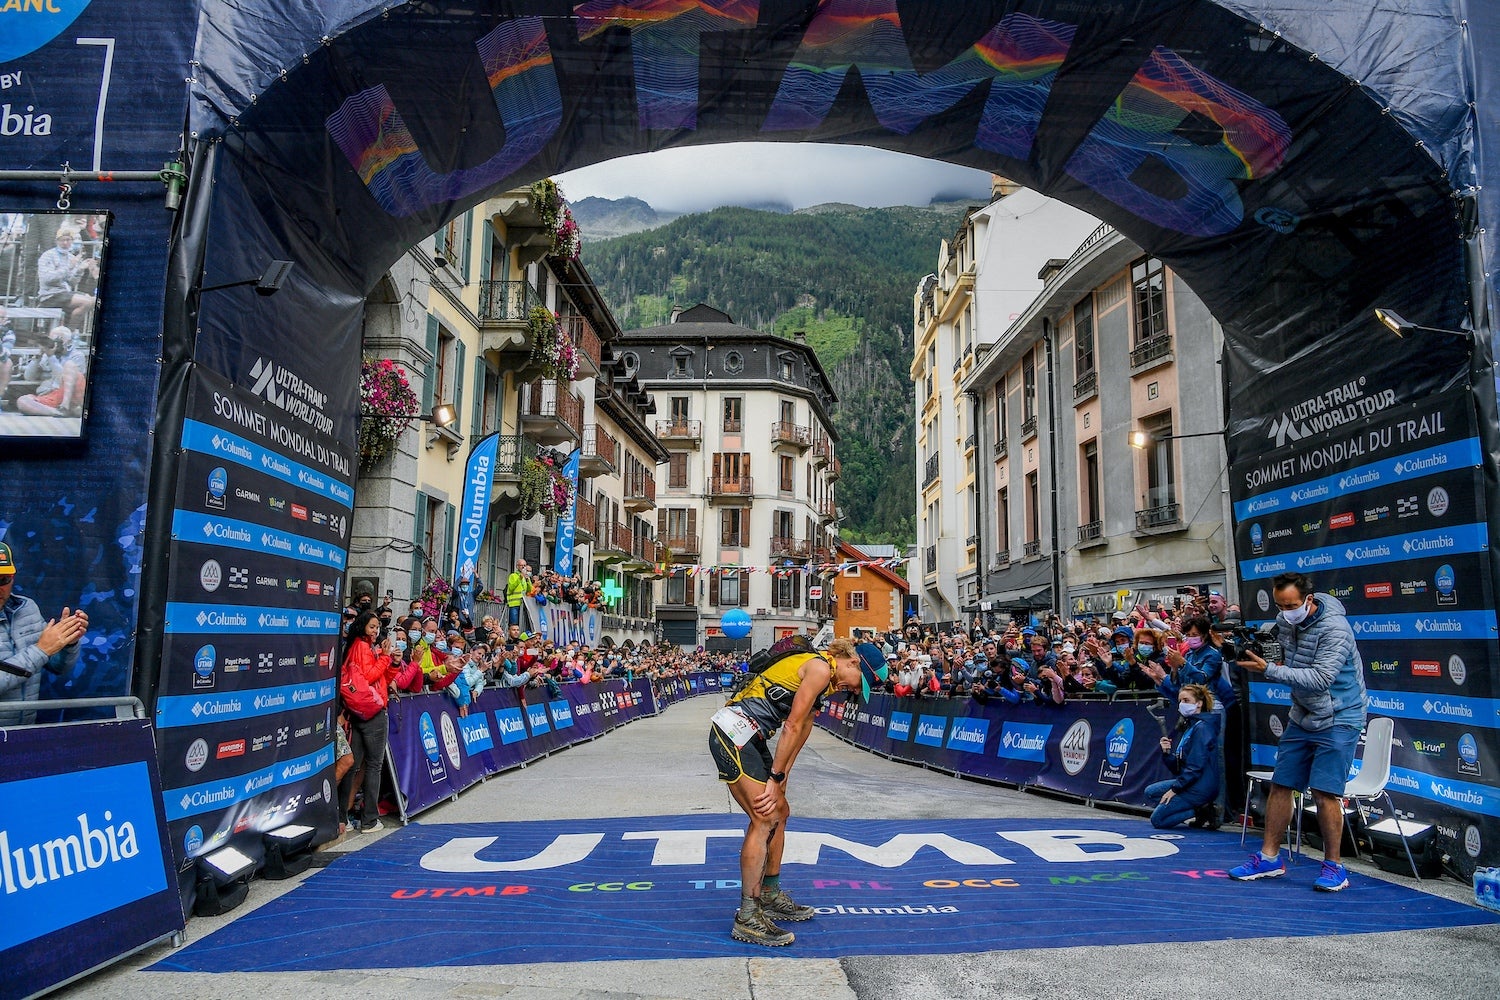
(Photo: Courtesy of UTMB)
Prior to the Western States 100 miler this year, Dr. Marshall Burke (an associate professor of Earth System Science at Stanford University) used historical race results to predict times. His predictions were so damn good that I’m not sure if we should worship him as a god or respect him as a badass witch.
Marshall’s predicted winning time for men was off by only 1.6%, and the women’s winning time was off by under 1%. Perhaps even more remarkably, his men’s 10th place estimated time was off by under 2%, while the women’s 10% place was only 2.5% off the mark.
Put together, his equations were within 30 minutes in every category, which is especially impressive considering how impactful the weather can be at Western States and how much the results fluctuate over time. I’m not saying we should burn him, I’m just saying we should check Amazon Prime to see if there are any deals on stakes.
And now, Marshall is back for UTMB! I coaxed him out of retirement for one last job. At work, he’s helping save the world from the impacts of climate change, so it feels a bit like asking Superman for help opening the pickle jar. But it’s UTMB week and we are craving some of those tangy statistics pickles!
Marshall’s mission, if he chose to accept it: give me some data that will help athletes racing UTMB this year, or that will provide some cool context for fans of the sport. His compensation? Respect, and being compared to a witch. Seems fair.
This is a fun passion project, rather than something designed for peer review, so the numbers could change. But if something is wrong, take solace in the fact that it’s only wrong in this particular universe, and that in some part of the multiverse, we are right.
It’s time for 4 takeaways on UTMB based on historical data. And if you really, really enjoy charts, it’s now time to take off your pants.
ADVERTISEMENT
One: The density of top-end competition is increasing rapidly.
As the sport gets more and more competitive, you’d expect gaps between athletes to narrow over time. And that’s exactly what we see. Our hypothesis game is ROBUST. This first chart shows the narrowing of men’s and women’s finish times since 2008.
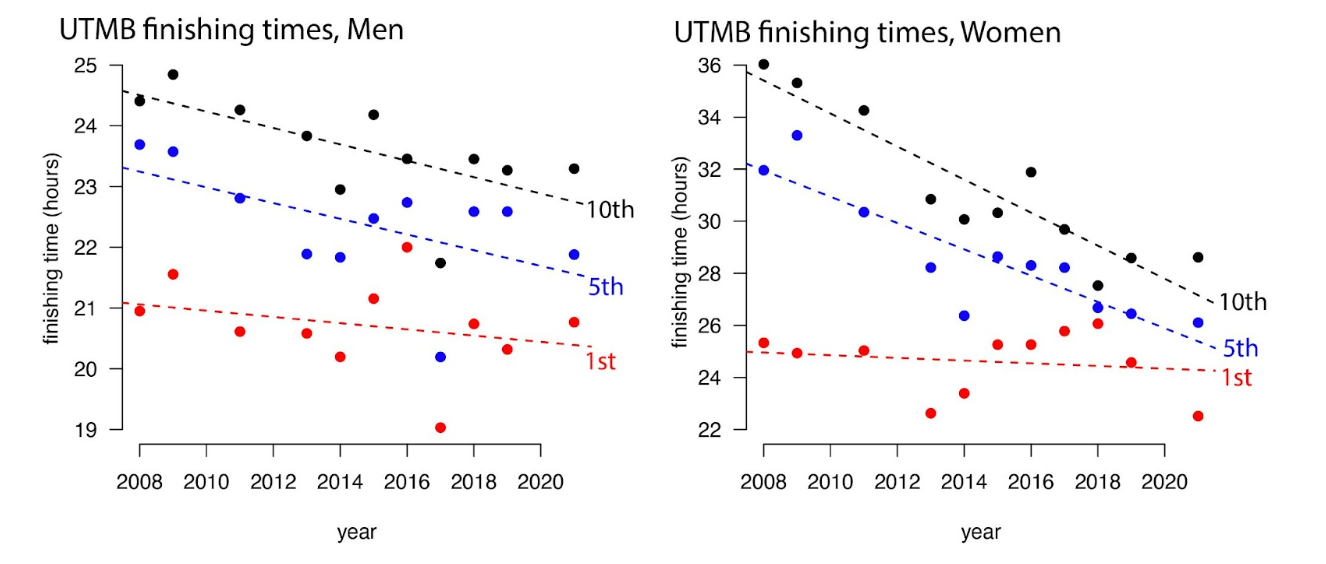
2010 and 2012 were removed from the data due to extremely altered courses. A few other years (e.g. 2017) had slightly shorter courses too.
For men, a simple linear relationship shows that finishing times for the winner have declined only slightly since Kilian first started winning in 2008, but they have come down about 12 minutes per year for both the 5th and 10th place finishers since then.
For women, the winning times are similarly only improving slightly (thrown off by some incredibly fast performances by Rory Bosio in 2013 and 2014). But the 5th place and 10th places are improving MASSIVELY, around 30 and 40 minutes per year, respectively.
At the pointy end of the race, there is less margin for error as athletes dial in training. Every year, more athletes put the race on their calendars with 18 unicorn stickers, signifying it’s the day to make like a unicorn horn and be sharp as hell. (People rarely talk about why unicorns have horns, but it’s obviously to kill or maim their enemies.)
Takeaway: as the sport professionalizes and UTMB gains even more prominence, athletes need to show up ready to throw down to have a shot at the top 10.
ADVERTISEMENT
Two: The early part of the race is about setting up for the 2nd half of the race. The 2nd half of the race is about going for glory.
Marshall next sent two of the coolest charts I have ever seen. These data visualizations show place at the major aid stations from the men’s 2021 race, for athletes that eventually finished in the top 50 overall, showing that athletes can move up a ton after Courmayeur at 80km (mile 50). But by Champex-Lac at 126km (mile 78), there is much less movement (aid station chart here).
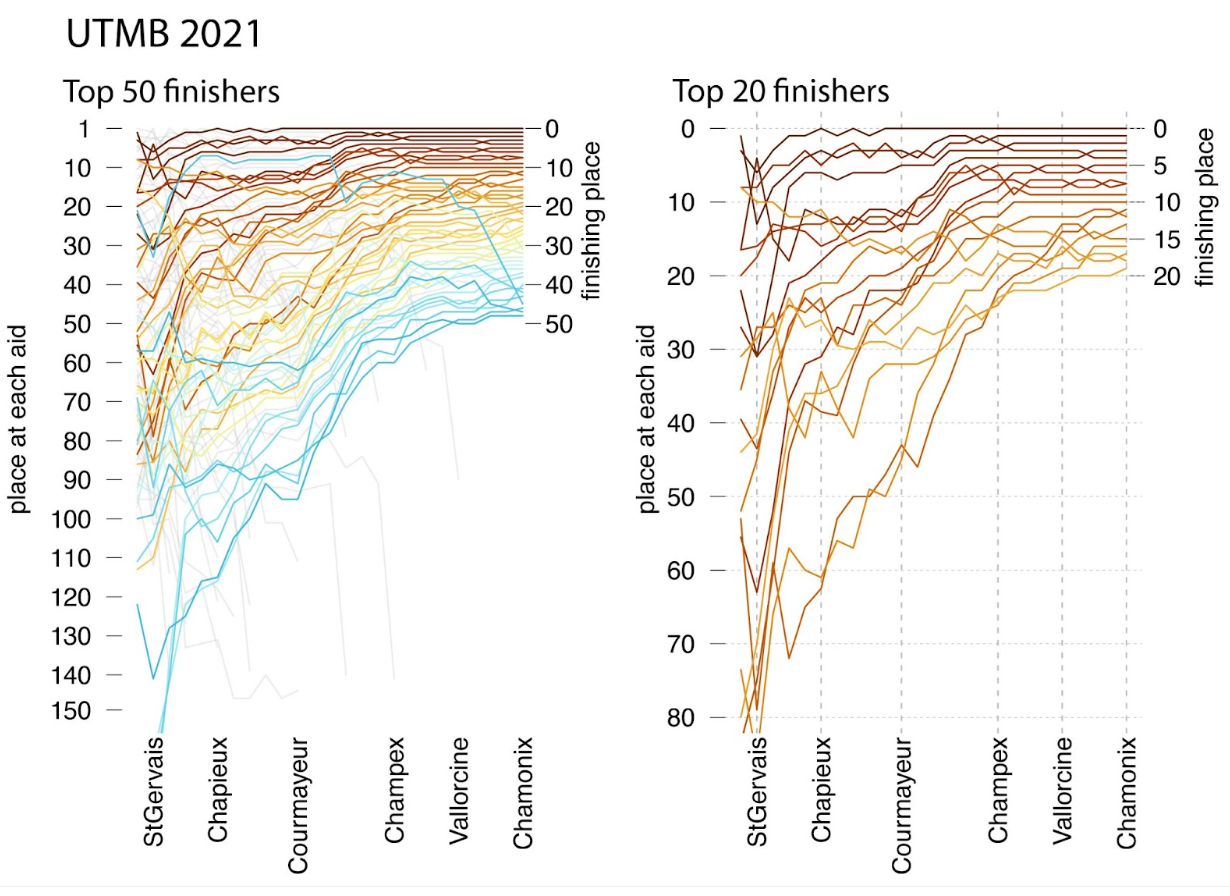
The gray lines in the first chart shows athletes that were initially in the top 50 and later dropped.
Each of these lines tell stories of triumph and defeat. At Les Chapieux at 50k, athletes can be way back and still have fantastic finishes. That is reflected in the correlation data for place at each aid station for the top 50 finishers.
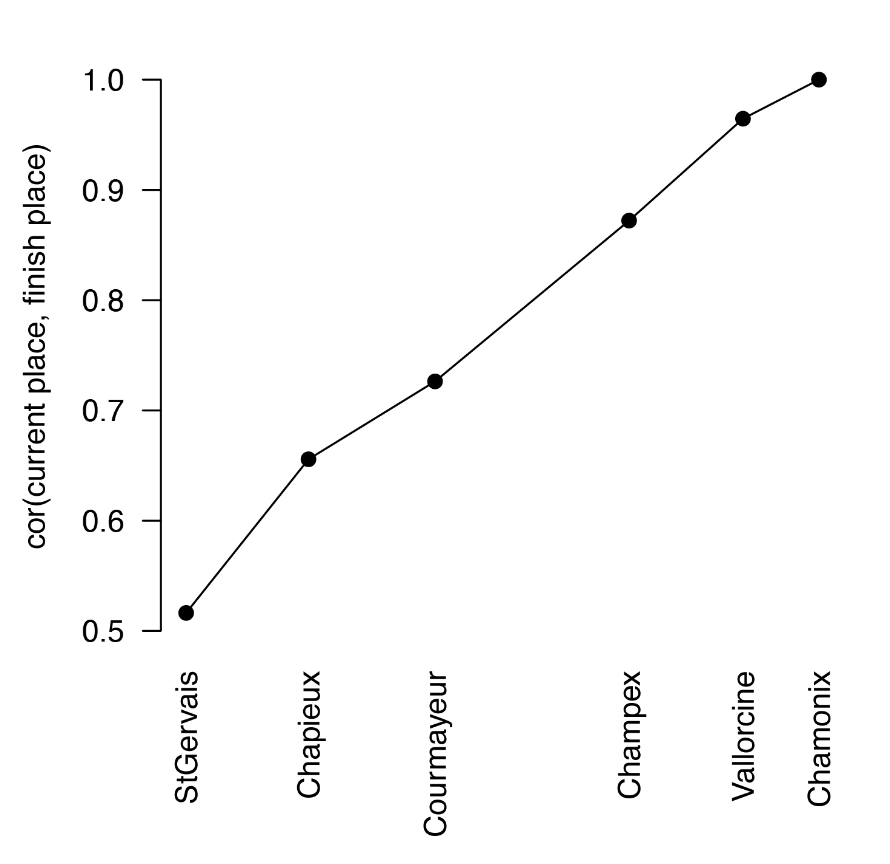
Given that the dataset is not a random sample and the finish places should be strongly associated with places earlier in the race, we’d expect very strong correlations. But at 50km, the correlation is only 0.66, which isn’t that high, showing how conservative pacing can pay off. Even at 80k, the correlation is just around 0.7.
The women’s times show a similar story. I’d be curious to have the same chart for other major races like Western States to see if the correlations are higher. My guess is that more than most races, UTMB rewards patience and trust in the first half. Just remember: miracles need to happen before Champex-Lac.
Let’s look at that information one more way, because I want to put this mind-bendingly fun chart above the bassinet in my future son’s bedroom. This chart looks at where the top finishers are at each aid station, now using data for all races back to 2008.
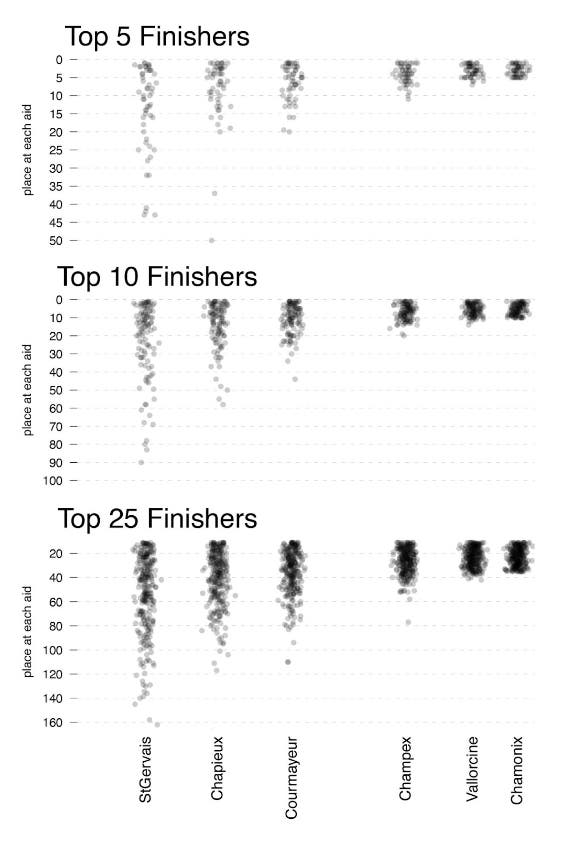
Historically, there are plenty of athletes that were outside of the top 10 through 50k and even 80k that finished in the top 5. For top 10, you can be well outside the top 20 at 80k and still have an incredible finish. Power moves are made between Courmayeur and Champex.
ADVERTISEMENT
Three: The second half makes the race.
UTMB is such a burly, difficult race that every athlete from the front to the back will be slowing down. Winners and losers are determined by a simple question: who can slow down the least?
The next chart shows the differences in times from Chamonix to Courmayeur (termed “first half” for ease of labeling, though it’s not a 1:1 comparison) and from Courmayeur to Chamonix. Top finishers slow down way less.
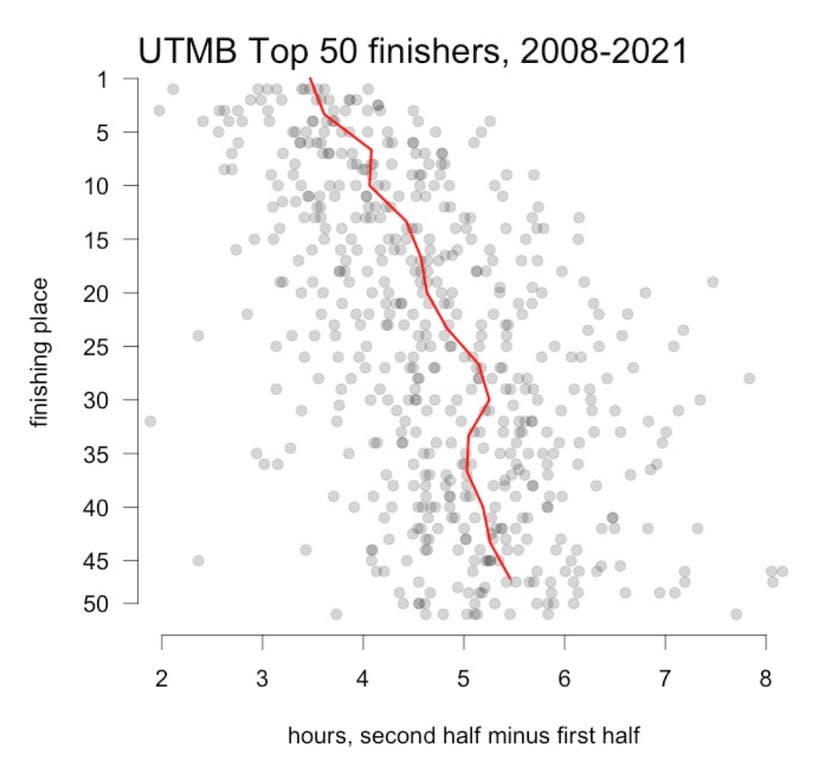
The difference in slow-down between podium and 10th place is almost an hour, and the difference between the podium and 25th place is about 2 hours. More conservative starts followed by fast finishes are rewarded in most cases. But that’s easier said than done.
And fast starts followed by fast finishes are best of all. This earth-shaking insight is what makes me a great coach.
ADVERTISEMENT
Four: Times are getting faster, and we are bringing some predictions.
As discussed earlier, times are improving rapidly, especially for the 5th and 10th place female finishers. I gave Marshall a difficult task: using only the time, distance, and year data available on the public databases, make some fancy regression equations to give me times for 1st, 5th, and 10th places. He stepped up to his flying broom and accounted for varying race distances to give this witchy chart:
| 2022 Prediction (hours) | ||||
| Finish place | Best estimate | Lower bound | Upper bound | |
| Men | 1st | 20.2 | 19.1 | 21.2 |
| 5th | 21.3 | 20.1 | 22.4 | |
| 10th | 22.4 | 21.6 | 23.3 | |
| Women | 1st | 24.2 | 22.1 | 26.2 |
| 5th | 24.9 | 23.0 | 26.8 | |
| 10th | 26.4 | 24.6 | 28.3 |
The confidence intervals, shown by the lower and upper bound predictions at the right, are wide given the small sample size. He is a witch with data integrity.
A major complication is weather–it’s tough to control for that variable in the high mountains, so it’s not considered in this regression (unlike the Western States model, which included temperature). Given the rainy forecast this year, it’s possible that the times will be much slower.
The men’s race is projected to be just over 20 hours, with the women just over 24 hours. Courtney Dauwalter went 22:30 last year, which shows that she breaks statistics like she breaks her competitor’s legs. The men’s time is predicted faster than François D’Haene in 2021.
More conservative starts followed by fast finishes are rewarded in most cases. But that’s easier said than done.
ADVERTISEMENT
Both the men’s and women’s top 10s are predicted to go very fast, significantly ahead of those marks in 2021. The same goes for the top 5. In other words, the model predicts 2022 to be a competitive barn-burner all the way to Chamonix.
To put my bias hat on, I think the men’s time is going to be closer to the lower bound if the weather isn’t too terrible. I predict a record on the current course with Jim Walmsley and Kilian Jornet going head-to-head, plus past podium finishers like Scotty Hawker on better fitness than ever.
RELATED: Will Jim Walmsley Be the First American Man to Win UTMB?
For women, I’m inclined to stick with the middle range of the model, since Courtney is such a miraculously amazing athlete and isn’t toeing the line this year. But perhaps the next Courtney is waiting for just this opportunity.
Personally, I hope the models fail and both course records get obliterated. I wouldn’t be surprised if they do. I also wouldn’t be surprised if Marshall nails the predictions within a percent, because he’s got that BWE (Big Witch Energy).
Saddle up on your brooms because we’re in for one helluva ride. What an exciting time to be a fan of this sport!
ADVERTISEMENT
David Roche partners with runners of all abilities through his coaching service, Some Work, All Play. With Megan Roche, M.D., he hosts the Some Work, All Play podcast on running (and other things), and they answer training questions in a bonus podcast and newsletter on their Patreon page starting at $5 a month.